With the Customer engagement initiative 2024 wrapped up, it’s the perfect time to reflect on the powerful insights we’ve gathered through NPS surveys and how they can contribute to delivering even better customer outcomes. Hosting the top performing advisers at our forum was a great opportunity to discuss these findings, and now we want to share these learnings with you.
First of all, what is NPS?
NPS is a simple but powerful tool that measures customer loyalty by looking at their likelihood of recommending a given business. This is measured with a single-question survey and reported with a number ranging from -100 to +100, where a higher score is desirable.
How likely are you to recommend [product/company] to a friend or colleague?
Customers respond on a scale of 0 to 10, and their answers categorise them as either promoters, passives, or detractors – the NPS score is then calculated by subtracting the percentage of detractors from the percentage of promoters.
Don’t get us wrong – NPS isn’t the be-all and end-all, as it can be unreliable with small sample sizes and overlooks non-respondents. However, its simplicity, standardisation and reliability make it a powerful tool that can also serve as a predictor of business growth.
Our top-3 CEI learnings.
1. NPS matters – it’s more than just a score.
The data is clear: detractors (customers who rate their experience lower) are 45% more likely to cancel their policies than promoters. Even more striking is that 50% of detractors are expected to cancel within 18-months. High NPS, on the other hand, signals not only customer satisfaction but also loyalty and advocacy, which have a huge influence on word-of-mouth referrals.
2. Clear and consistent communication is key.
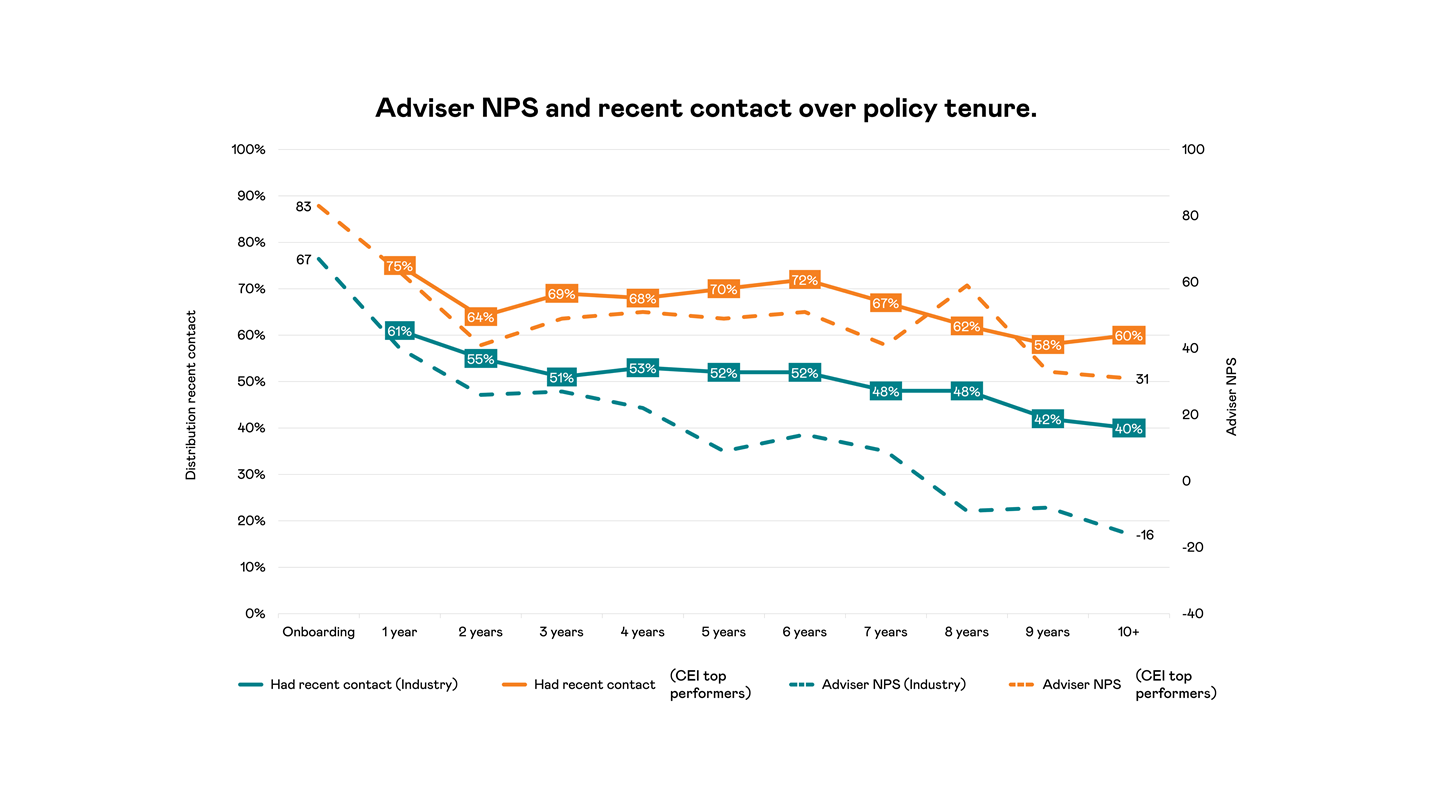
One of the strongest drivers of customer satisfaction is effective communication. Our findings reveal that new customers across the industry show an NPS of +73, reflecting high satisfaction at the start of their journey. However, this satisfaction declines significantly if communication isn’t maintained. Without regular and clear communication, NPS can fall by up to 2.5 times by the end of the second year. This underscores the importance of keeping clients informed, setting clear expectations, and providing updates—especially during key moments in their policy lifecycle.

3. Turnaround times impact adviser. perception – but that’s not all.
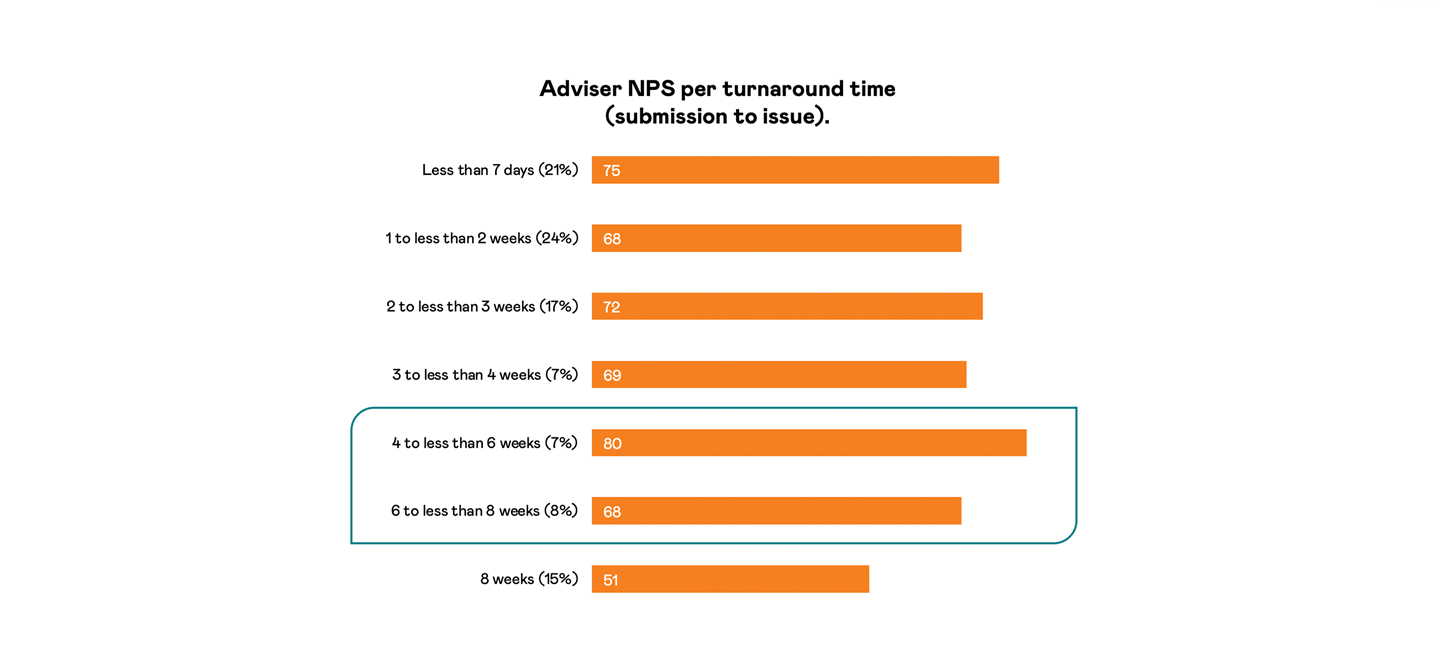
While quick turnaround times are important, what truly drives positive customer experiences is transparent communication. Data shows that even when policies take longer to process, customers who receive regular updates are much more satisfied than those left in the dark. Advisers who consistently inform their clients about delays or progress see little to no drop in NPS – even when processing times stretch beyond expected durations. This insight highlights that it’s not just about speed but about managing expectations and keeping the communication lines open. Customers appreciate transparency, and timely communication can mitigate potential frustrations.

What’s next?
We hope you’ll find these learnings useful; they’re a powerful reinforcement of the importance of communication and the value of measuring customer sentiment with NPS.
As we wrap up this initiative, we're excited to continue developing more ways to drive outstanding outcomes for our customers while providing valuable insights to you, our adviser community.
If you have any questions, please feel free to get in touch with your Business manager. We’ll have more actionable intel coming in future editions of the On point newsletter.
